.png)


The licence is the number everyone sees. It is rarely the number that matters. A decision-maker’s guide to the full cost of Power Platform - and how to model it before you commit.
The per-user licence is the number that gets quoted, compared and put in the budget. It is also a fraction of what Power Platform actually costs - and the gap between the two is where business cases quietly fall apart eighteen months in, when the consumption bill arrives, the maintenance load builds, and the storage runs out. None of it was hidden. It was simply never counted. The instinct that makes this worse is the one that sells low-code in the first place: because building is cheap and fast, the whole thing feels cheap - right up to the point where the costs that were never on the page start to land. Total cost of ownership is the discipline of counting the whole thing before you commit, and this guide sets out the model, the costs that ambush the unprepared, and how to build a figure you can defend.
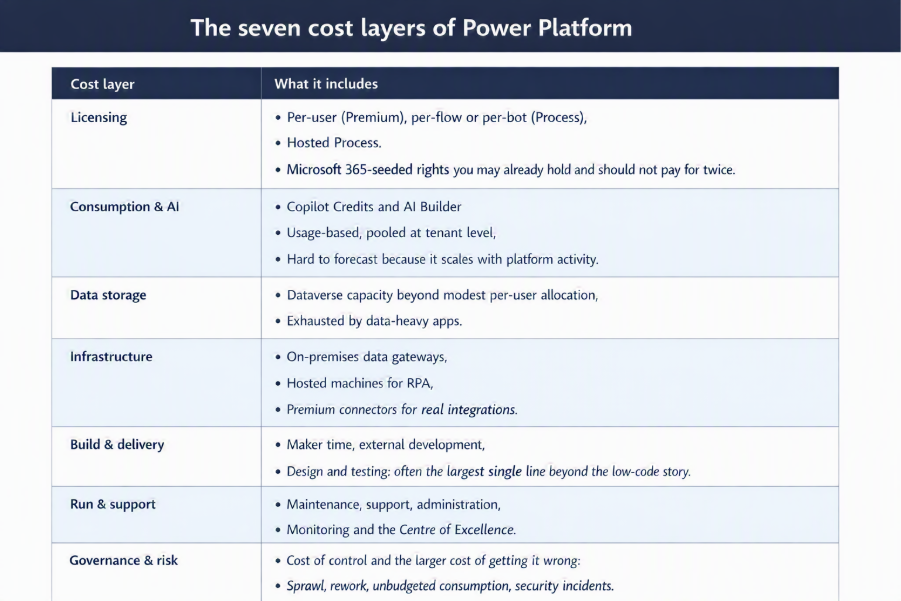
The seven cost layers of Power Platform
A credible TCO model has seven layers. The first is the one everyone quotes. The other six are where the money actually goes.
The costs that ambush business cases
Within those layers, a handful of specific costs account for most of the unpleasant surprises. If your model accounts for these, it will already be more honest than most:
- The premium-connector jump. A flow that works for free on standard connectors needs a paid licence the moment it touches SQL, Salesforce or Dataverse - and that can turn a “free” automation into a licence for everyone who uses it.
- The wrong licensing model. Licensing hundreds of users individually for a single shared flow, when a per-flow plan would have cost a fraction, is the most common and most expensive mistake in the category.
- Unattended RPA and its infrastructure. Unattended automation carries an add-on per concurrent bot and, often, hosted-machine costs - sized by how many run at once, not how many processes exist.
- AI consumption. Copilot Credits accrue with use, and the seeded AI Builder credits many business cases quietly assume are being withdrawn - so any plan reaching into 2027 needs its AI costs re-based rather than assumed free.
- Maintenance drag. Flows and desktop automations break when the systems beneath them change; over a three-year horizon, keeping them running is a recurring cost, not a one-off build.
Consider how these stack in practice. A departmental automation is scoped against a modest per-user licence and approved on that basis. Then it needs a premium connector to reach the finance system, so the licence tier rises. It stores its data in Dataverse, which quietly consumes paid capacity. It was built by a contractor over several weeks - a one-off cost larger than a year of licences - and six months later, when the finance system is upgraded, it breaks and needs reworking. Every one of those costs was foreseeable. Only the first was in the business case. Multiply that across an estate and you see why the licence figure and the real figure diverge so sharply.
The cost of governing badly
The most counterintuitive line in a TCO model is governance - because under-investing in it is a cost, not a saving. An ungoverned platform generates duplicated apps, orphaned flows, shadow IT, runaway consumption and, eventually, an incident or a painful remediation programme. Every one of those is a real cost; they simply arrive later and under a different heading. A Centre of Excellence is a visible cost line that reduces the invisible ones. Leaving it out of the model does not make the platform cheaper - it just moves the bill into next year and makes it larger. The organisations that are surprised by their Power Platform costs are almost always the ones that treated governance as the thing to cut, rather than the thing that keeps the total down.
How to build a defensible TCO model
Turning this into a number you can take to a board is a matter of a few disciplines:
- Model three years, not one. Licences renew, usage grows and maintenance compounds. A one-year figure flatters the decision and misleads the budget.
- Separate one-off from recurring. Build is largely a one-time cost; licensing, consumption and run are forever. Boards need to see both, not a single blended number.
- Base licensing on usage, not headcount. Model who makes, who consumes and what is shared - that pattern, not the size of the organisation, decides which licensing model is cheapest.
- Forecast consumption explicitly. Estimate Copilot Credit and AI usage and set caps. A blank line for AI is the fastest route to a surprise.
- Cost the people. Build and run time are usually the largest lines. A model that counts only licences is not a TCO model.
- Compare against the real baseline. Weigh the figure against the true cost of the process today - the manual effort, or the incumbent tool you would replace, including its own hidden costs - not against zero.
- Add a governance line and count it as risk reduction. A Centre of Excellence is a real cost, but it is the line that shrinks the others; model it as an investment that lowers total cost, not as overhead.
- Revisit it annually. Usage grows, Microsoft changes pricing and packaging, and new AI features arrive. A TCO model built once and never reopened is out of date within a year.
A caution: TCO is not the same as value
One important balance. The goal is not the lowest total cost of ownership; it is the best return. A higher-TCO solution that automates a high-value, high-volume process comfortably beats a cheaper one that automates something trivial. TCO exists to tell you the cost side of that equation honestly, so you can weigh it against the value side - it is a decision tool, not a cost-cutting exercise. Used well, it does two things at once: it stops you approving a cheap-looking project that will cost far more than expected, and it stops you rejecting a costlier one that will pay for itself many times over. The organisations that get the most from Power Platform are not the ones that spent the least. They are the ones that knew what they were spending, and why.
The bottom line
The licence is the tip of the iceberg. The organisations that stay in control of Power Platform cost are the ones that modelled the whole thing - licensing, consumption, storage, infrastructure, build, run and governance - before they committed, and revisited it as usage grew. The figure that matters is never the one on the price list. It is the one you build yourself, honestly, across the full life of the platform.
VE3 helps organisations model the true cost of Power Platform and choose the licensing and delivery approach that is genuinely cheapest for their usage. Our free Power Platform Readiness Framework surfaces the cost-driving answers - licensing, storage, consumption and governance - across eleven domains, so your TCO is built on evidence, not assumption.

.png)
.png)


