Analyse and optimise overall operations by integrating data from various sources. Our solution enables organisations to gain a holistic view of their performance and identify areas for improvement.
Business Intelligence enables organisations to move beyond static reports and gain real-time visibility into performance, risk and opportunity.
As data volumes grow across departments, platforms and geographies, leaders require a unified, governed view that supports faster and more confident decision-making.
At VE3, we design and implement scalable BI ecosystems that consolidate fragmented data into a single, trusted source of insight.
By combining modern data platforms, interactive dashboards and robust governance frameworks, we help enterprises monitor KPIs in real time, improve operational transparency, strengthen accountability and align teams around measurable business outcomes that drive sustained, strategic growth.
We deliver end-to-end Business Intelligence services that support modern enterprise needs and evolving decision models.

We define BI strategies aligned with business goals and design scalable architectures that support reporting, analytics, and future growth. Our approach ensures BI investments deliver long-term value.

We integrate data from multiple sources into centralized, cloud-ready data warehouses and analytics platforms. This creates a reliable foundation for consistent reporting and enterprise-wide insights.

We design intuitive dashboards and automated reports that provide clear visibility into performance metrics. Role-based views ensure executives, managers, and teams see insights relevant to their decisions.

We enable self-service BI that allows business users to explore data independently using intuitive tools, reducing dependency on IT and accelerating insight generation.

We embed BI directly into enterprise applications and workflows, ensuring insights are available at the point of decision and increasing adoption across the organization.

We establish governance frameworks to ensure data accuracy, consistency, security, and compliance, building trust in BI outputs and supporting enterprise standards.


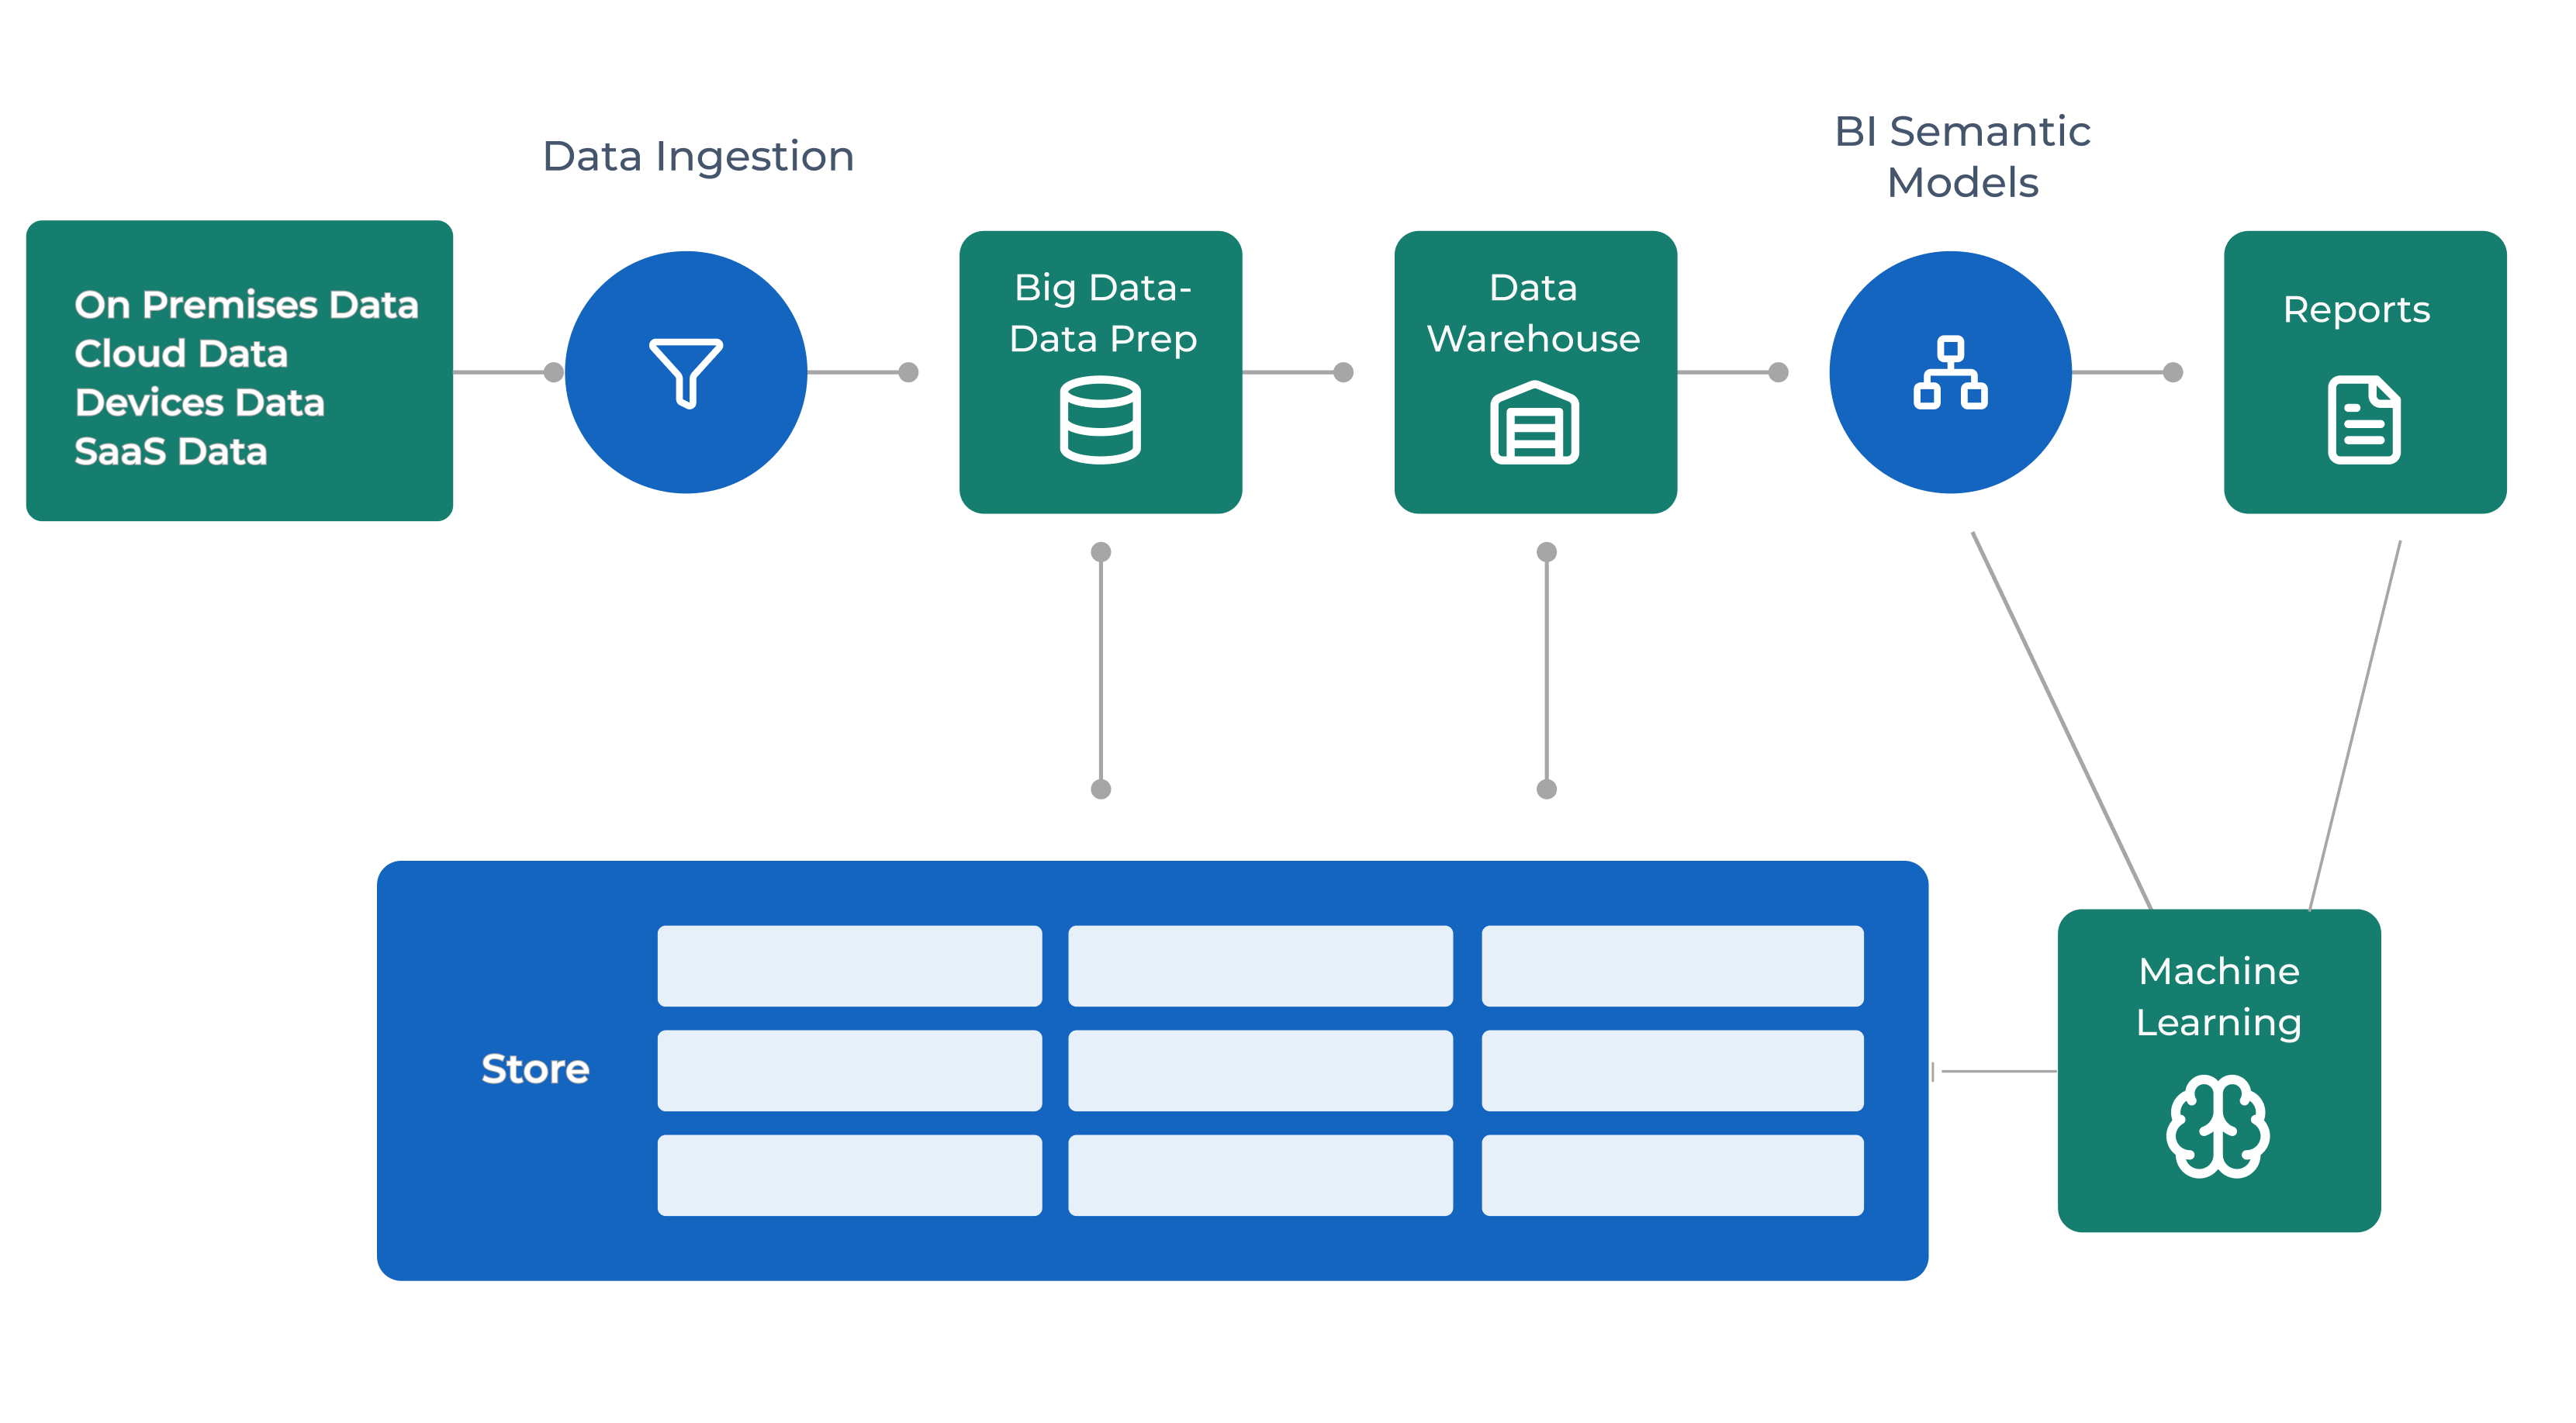
Here at VE3, our business intelligence architecture framework is designed to provide a comprehensive and scalable approach to managing data and analytics in an organisation by leveraging their data assets effectively, making data-driven decisions, and ultimately driving growth and success.
We identify and integrate data from various sources, ensuring data accuracy, completeness, and consistency while addressing data security and privacy concerns.
We transform and store the data in a centralised data repository for data cleansing, integration, and modelling to ensure that the data can be easily accessed and analysed.
We use analytical tools to extract insights and identify patterns in the data with data mining, predictive analytics, and machine learning, ultimately enabling data-driven
decision–making.
We present data and insights in a visually appealing and easy-to-understand format with dashboards, reports, and visualisations that help to identify key trends and insights.
Analyse and optimise overall operations by integrating data from various sources. Our solution enables organisations to gain a holistic view of their performance and identify areas for improvement.
Real-time insights into operational processes and help organisations optimise their workflows by monitoring key metrics such as production efficiency, inventory levels, and resource utilisation.
Deeper understanding of customer behaviour, preferences, and user needs by analysing customer data from various sources with tailored products and services creation and deployment.
Monitor and mitigate financial risks such as credit, market, and operational risks by integrating data from various financial systems, providing real-time insights into financial performance.
Analysing supply chain data such as inventory levels, order fulfilment, and shipping performance, we help organisations reduce costs, improve delivery times, and increase customer satisfaction.
Evaluate data from various systems, such as server logs, application performance, and user behaviour. Our solution can help organisations identify issues and improve their software deployment processes.
Optimise e-commerce operations, from website performance to customer engagement, by leveraging data from various e-commerce systems to help improve online presence and increase sales.
Improve product offerings, enhance their brand reputation, and increase market share by understanding brand and product performance and analysing data on sales, customer feedback, and market trends.
Our data analytics approach is structured, scalable, and business-focused

Understand business objectives, KPIs, and data sources

Architect secure, scalable BI platforms

Develop dashboards, reports, and analytics models

Empower users with self-service and embedded BI

Continuously improve performance, adoption, and value
Our Business Intelligence services support complex, data-intensive environments across industries, including:
Organizations partner with VE3 for Business Intelligence because we combine strong technical expertise with a deep understanding of enterprise decision-making.

.png)


Stay current with the strategies, trends, and technologies defining the next era of digital excellence


.png)


.png)