

The question that stalls every transformation
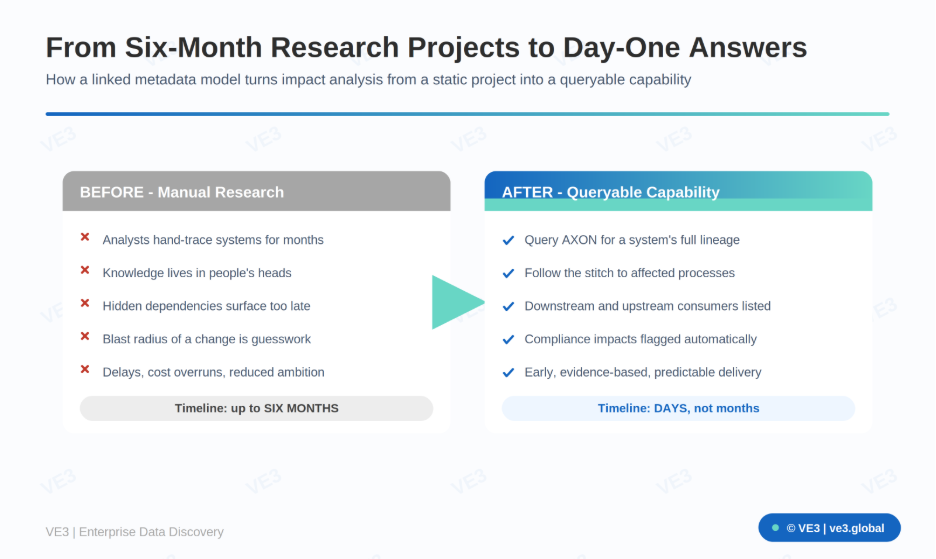
“What breaks if we retire this system?” It sounds simple. In most large organisations, answering it honestly takes months. Analysts hand-trace connections across systems, chase down the people who remember how a feed works, and assemble a picture that is out of date by the time it is finished. Meanwhile the programme waits, the decision slips, and the risk of an unseen dependency grows.
The cost is not just time. When impact analysis is slow, teams stop asking the question. Changes go ahead on optimism rather than evidence, and the hidden dependency surfaces in production instead of in a workshop. This is precisely how transformations accumulate delays, cost overruns and reduced ambition.
From static project to live query
A linked metadata model changes the economics entirely. Because the physical data view (lineage, quality, classification) is connected to the logical process view (BPMN maps, applications, capabilities), impact analysis becomes a dynamic, queryable capability rather than a bespoke research effort.
How the query actually runs
Take a real scenario: a programme manager needs to assess the full business and technical impact of retiring a legacy system. With the linked model in place, the analysis runs in three moves:
- Query the data hub for the system. The lineage view instantly returns a complete, validated list of every physical data asset and dataflow originating from or feeding it.
- Follow the stitch to the architecture hub. The query retrieves all the business processes — drawn from the BPMN 2.0 maps — that depend on those dataflows, along with their applications.
- Read the blast radius. A comprehensive, multi-layered impact picture is delivered in days: affected business processes, data consumers, downstream reports and impacted stakeholders.
The dependency mapping behind the speed
The instant answer is only possible because the dependency map was built methodically beforehand, across four layers:
- Technical dependency analysis — which systems read from which sources, which write to which destinations, and all shared database dependencies.
- Data lineage tracking — attribute-level, column-to-column transformations, business rules and quality checks.
- Business process dependency analysis — which processes depend on which specific data elements.
- Timing and sequencing analysis — batch windows, processing order and real-time requirements that create hidden dependencies.
The impact framework then documents the blast radius of any change: downstream consumers, upstream sources, business processes affected, stakeholders impacted and compliance implications — for example, where a data element feeds a statutory report.
The bottom line
When impact analysis takes months, people stop doing it. When it takes days, it becomes a habit — and that habit is what makes programme delivery predictable instead of hopeful.
VE3 builds the linked metadata models and attribute-level lineage that turn impact analysis into a same-day capability. To find out how VE3 can help your programmes answer “what breaks if we change this?” in days rather than months, visit ve3.global.
.png)
.png)
.png)


