Business Intelligence

Unlock insights & empower decisions

Turning Enterprise Data into Actionable Business Insights

Business Intelligence enables organisations to move beyond static reports and gain real-time visibility into performance, risk and opportunity.

As data volumes grow across departments, platforms and geographies, leaders require a unified, governed view that supports faster and more confident decision-making.

At VE3, we design and implement scalable BI ecosystems that consolidate fragmented data into a single, trusted source of insight.

By combining modern data platforms, interactive dashboards and robust governance frameworks, we help enterprises monitor KPIs in real time, improve operational transparency, strengthen accountability and align teams around measurable business outcomes that drive sustained, strategic growth.

Our Business Intelligence Capabilities

We deliver end-to-end Business Intelligence services that support modern enterprise needs and evolving decision models.

White data analysis icons including pie chart, bar graph, list, and gear on blue background.

BI Strategy & Architecture

We define BI strategies aligned with business goals and design scalable architectures that support reporting, analytics, and future growth. Our approach ensures BI investments deliver long-term value.

Icon of two connected puzzle pieces with human heads, representing teamwork or collaboration.

Data Integration & Warehousing

We integrate data from multiple sources into centralized, cloud-ready data warehouses and analytics platforms. This creates a reliable foundation for consistent reporting and enterprise-wide insights.

White analytics icons including pie chart, line graph, and bar chart on blue rounded square background.

Dashboards & Reporting

We design intuitive dashboards and automated reports that provide clear visibility into performance metrics. Role-based views ensure executives, managers, and teams see insights relevant to their decisions.

Icon of a brain with a growth arrow next to three rising bar chart columns.

Self-Service Business Intelligence

We enable self-service BI that allows business users to explore data independently using intuitive tools, reducing dependency on IT and accelerating insight generation.

White analytics dashboard icon with bar and line charts on blue rounded square background.

Embedded Analytics

We embed BI directly into enterprise applications and workflows, ensuring insights are available at the point of decision and increasing adoption across the organization.

White document icon with shield on teal rounded square background representing security or protection.

Data Governance & Security

We establish governance frameworks to ensure data accuracy, consistency, security, and compliance, building trust in BI outputs and supporting enterprise standards.

Clients and Partner

Sport England logoHMRC logoMinistry of Defence logoLondon Councils logoDHSC logoDESNZ logo

Our BI Architecture Framework

Here at VE3, our business intelligence architecture framework is designed to provide a comprehensive and scalable approach to managing data and analytics in an organisation by leveraging their data assets effectively, making data-driven decisions, and ultimately driving growth and success. 

White data analysis icons including pie chart, bar graph, list, and gear on blue background.

Data Sources

We identify and integrate data from various sources, ensuring data accuracy, completeness, and consistency while addressing data security and privacy concerns. 

Icon of two connected puzzle pieces with human heads, representing teamwork or collaboration.

Data Warehousing

We transform and store the data in a centralised data repository for data cleansing, integration, and modelling to ensure that the data can be easily accessed and analysed. 

Icon of a brain with a growth arrow next to three rising bar chart columns.

Data Analytics

We use analytical tools to extract insights and identify patterns in the data with data mining, predictive analytics, and machine learning, ultimately enabling data-driven
decision–making. 

White analytics dashboard icon with bar and line charts on blue rounded square background.

Reporting and Visualisation

We present data and insights in a visually appealing and easy-to-understand format with dashboards, reports, and visualisations that help to identify key trends and insights. 

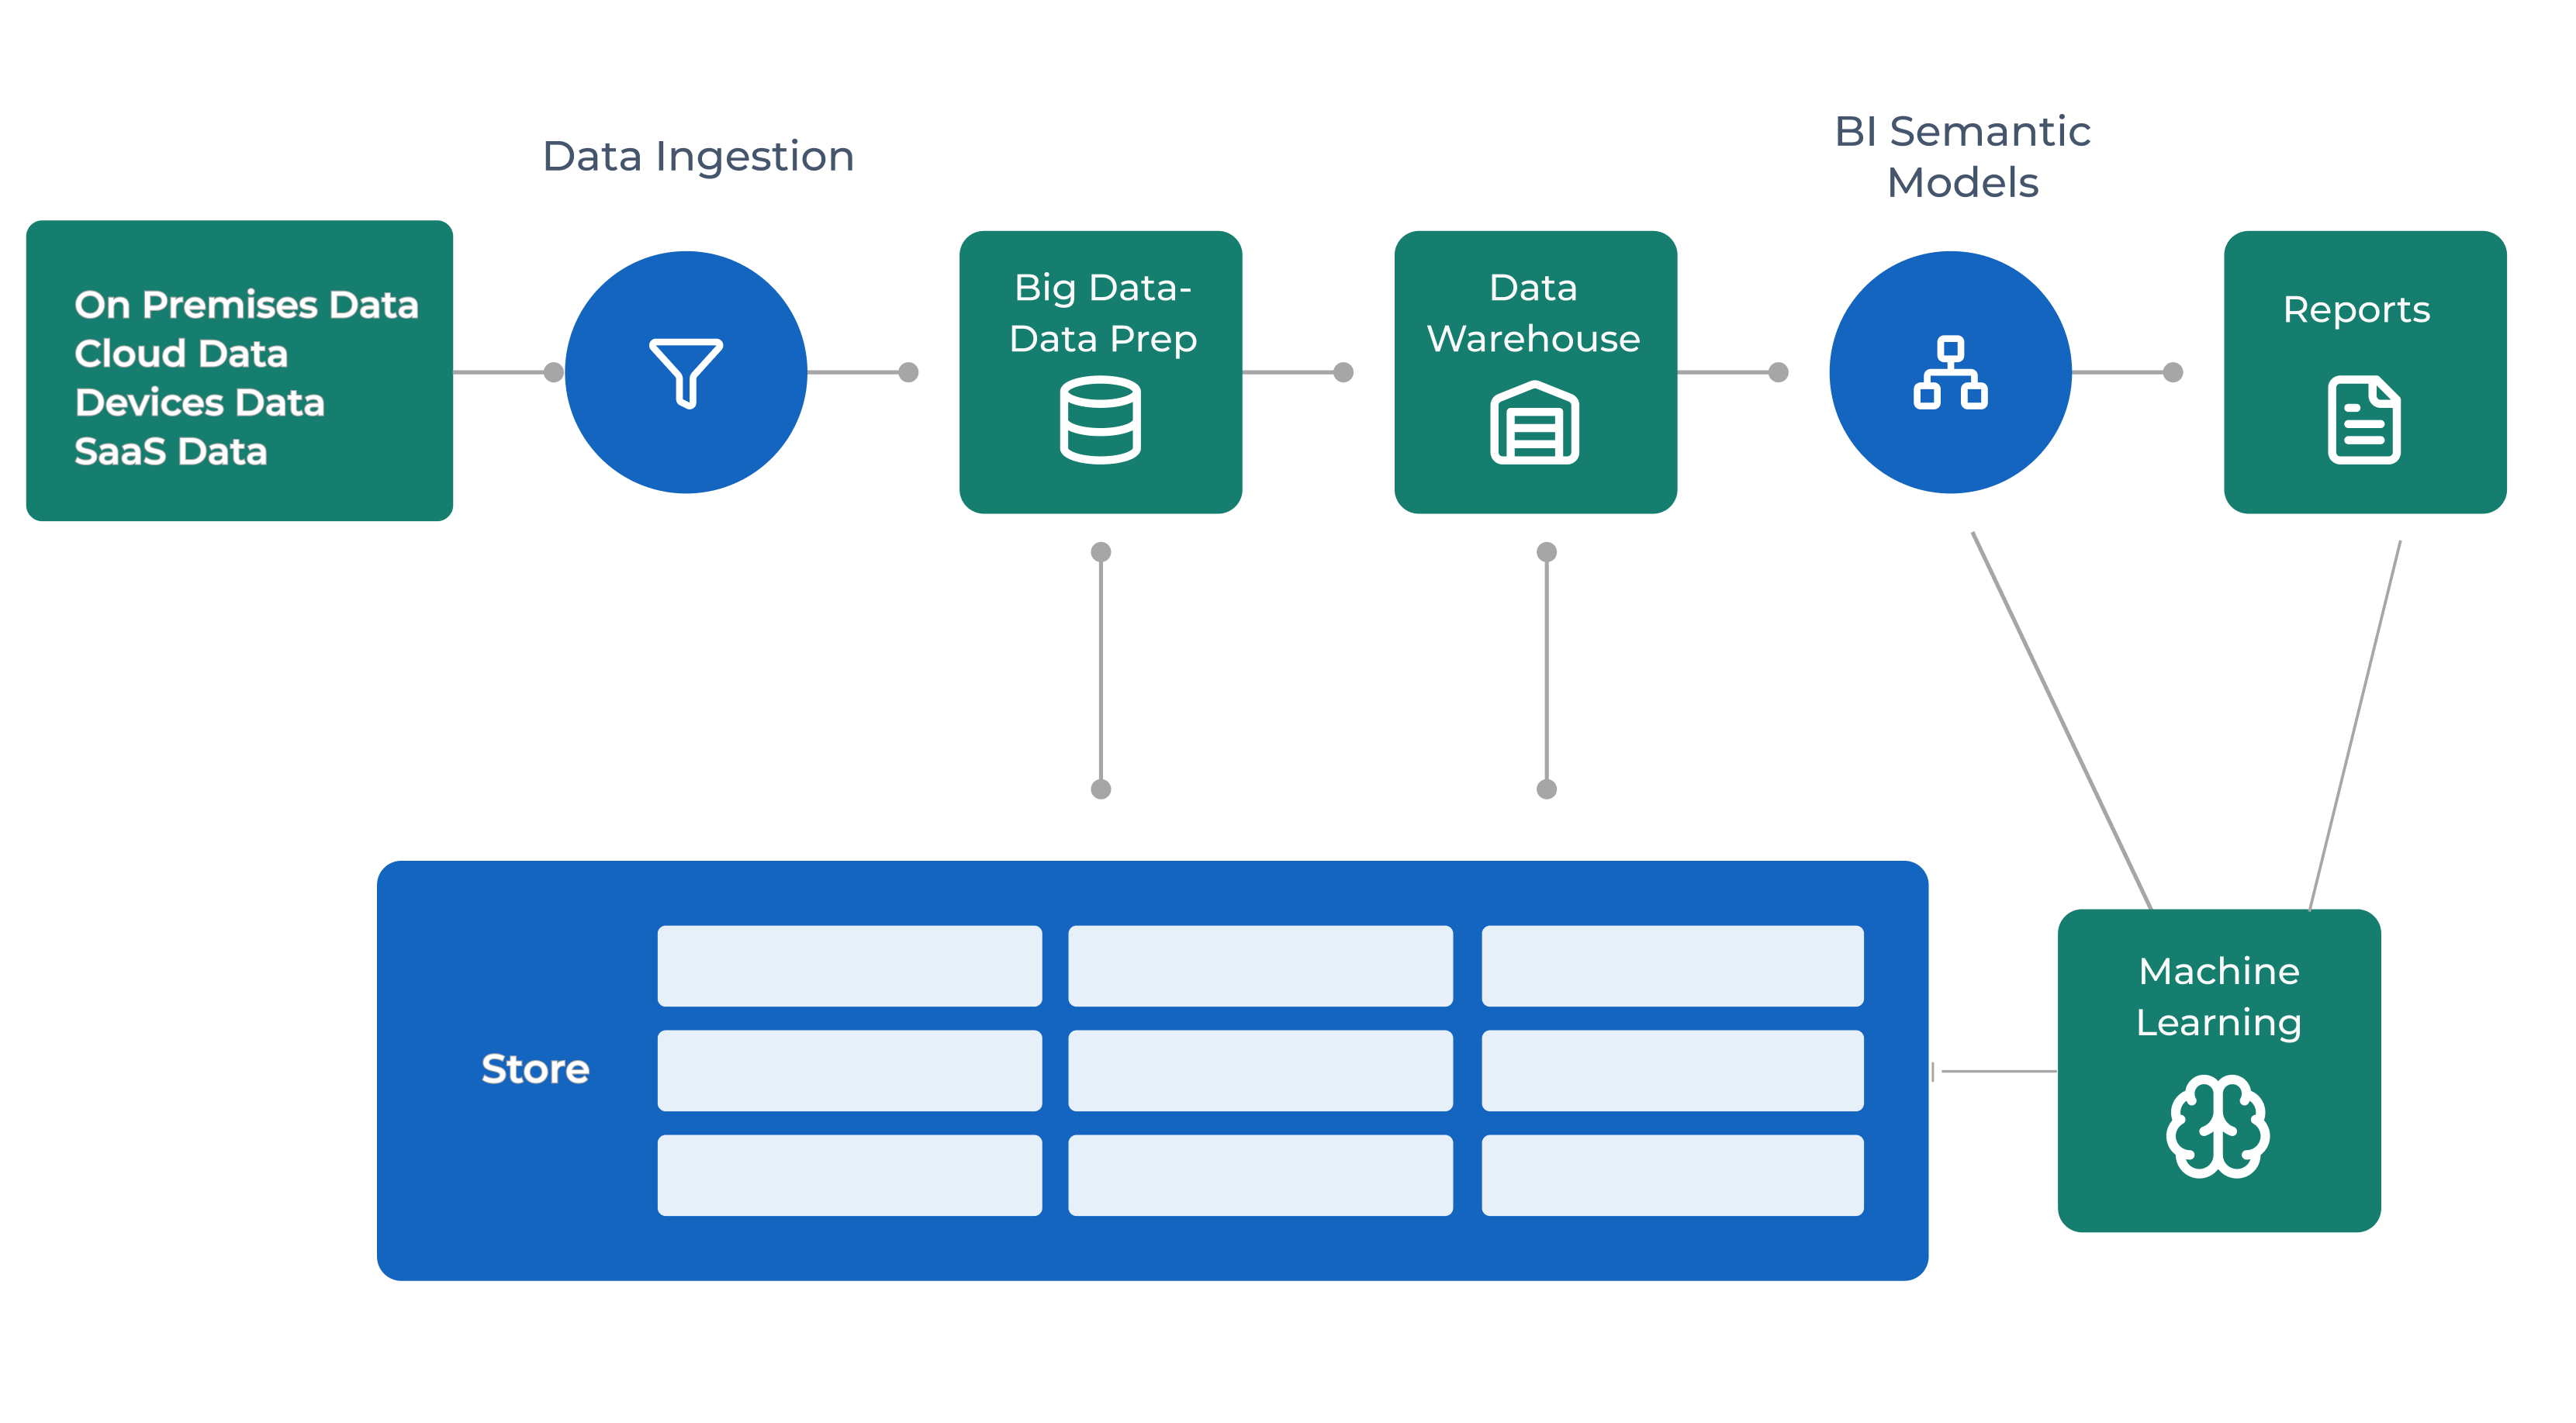
Our BI Architecture Framework

Flowchart showing data ingestion, storage, and BI semantic models with machine learning and reports.

BI Solution Use Cases

01. Enterprise Intelligence

Analyse and optimise overall operations by integrating data from various sources. Our solution enables organisations to gain a holistic view of their performance and identify areas for improvement.

02. Operational Intelligence

Real-time insights into operational processes and help organisations optimise their workflows by monitoring key metrics such as production efficiency, inventory levels, and resource utilisation.

03. Customer Intelligence

Deeper understanding of customer behaviour, preferences, and user needs by analysing customer data from various sources with tailored products and services creation and deployment.

04. Financial Risk Management

Monitor and mitigate financial risks such as credit, market, and operational risks by integrating data from various financial systems, providing real-time insights into financial performance.

05. Supply Chain Management

Analysing supply chain data such as inventory levels, order fulfilment, and shipping performance, we help organisations reduce costs, improve delivery times, and increase customer satisfaction.

06. Deployment Intelligence

Evaluate data from various systems, such as server logs, application performance, and user behaviour. Our solution can help organisations identify issues and improve their software deployment processes.

07. E-commerce Intelligence

Optimise e-commerce operations, from website performance to customer engagement, by leveraging data from various e-commerce systems to help improve online presence and increase sales.

08. Brand & Product Intelligence

Improve product offerings, enhance their brand reputation, and increase market share by understanding brand and product performance and analysing data on sales, customer feedback, and market trends.

Our Approach 

Our data analytics approach is structured, scalable, and business-focused

Icon of a light bulb and document on a blue circular background with gray decorative circles.

Assess

Understand business objectives, KPIs, and data sources

Icon of a computer monitor with a paintbrush symbolizing graphic design or digital art.

Design

Architect secure, scalable BI platforms

Icon of a web browser window showing coding brackets inside a blue circle with surrounding light circles.

Build

Develop dashboards, reports, and analytics models

Hand holding an outlined person icon with rays, symbolizing care or support.

Enable

Empower users with self-service and embedded BI

Gear icon with circular arrows around it representing settings or system updates.

Optimize

Continuously improve performance, adoption, and value

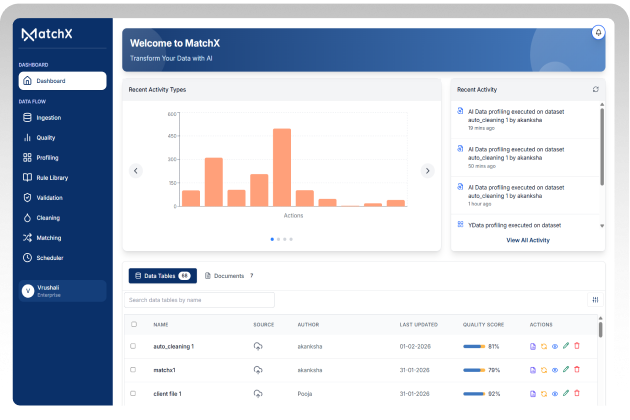
Gain powerful insights with MatchX

We enables businesses to efficiently handle and process large volumes of data and we also build robust data pipelines, optimise storage and processing,

Learn More
MatchX dashboard showing data ingestion, profiling, quality scores, recent activities, and data tables list.

Industries We Support

Our Business Intelligence services support complex, data-intensive environments across industries, including:

Why VE3 

Organizations partner with VE3 for Business Intelligence because we combine strong technical expertise with a deep understanding of enterprise decision-making.

White hand holding a glowing light bulb on blue rounded square background.

Experience delivering BI solutions at enterprise scale

Illustration of five test tubes with colored liquids, each with a white label and red caps.
White cloud with circuit board lines and nodes inside a teal rounded square icon.

Platform-agnostic expertise across leading BI and cloud tools

Illustration of five test tubes with colored liquids, each with a white label and red caps.
Hand holding a gear with a dollar sign inside, symbolizing financial service or support.

Focus on outcomes, adoption, and measurable ROI

Illustration of five test tubes with colored liquids, each with a white label and red caps.
Icon of a bar and line graph representing data analytics or statistics.

Strong capabilities across data, analytics, and AI

Illustration of five test tubes with colored liquids, each with a white label and red caps.
White ascending bar chart with arrow on blue rounded square background symbolizing growth or progress.

Scalable solutions for mid-size and large organizations

Read the Latest Insights and Thought Leadership

Stay current with the strategies, trends, and technologies defining the next era of digital excellence

Stop running five transformation programmes: why security, data, modernisation and AI belong on one roadmap

Prabal Laad
Read More
right blue arrow

The resilient supply chain: why visibility and security have become the same problem

Prabal Laad
Read More
right blue arrow

Becoming an AI-Ready Enterprise on Azure

Prabal Laad
Read More
right blue arrow

Making Sap Agent-Ready: What Joule and Joule Studio Do, and What They Don’t

Prabal Laad
Read More
right blue arrow

Letting Agents Touch the System of Record: Interfacing AI With Your Erp Safely

Prabal Laad
Read More
right blue arrow

The AI Skills Gap Is Not the Problem Most Leaders Think It Is

Pamela Sengupta
Read More
right blue arrow

What AI Transformation in the Finance Function Actually Looks Like

Pamela Sengupta
Read More
right blue arrow

The True Cost of Shadow AI - What Happens When Governance Does Not Keep Pace with Adoption

Pamela Sengupta
Read More
right blue arrow

Why AI Programmes Stall Before They Scale, and What the Ones That Do Not Have in Common

Pamela Sengupta
Read More
right blue arrow

The Change Management Side of AI Transformation That Most Programmes Underestimate

Pamela Sengupta
Read More
right blue arrow

How Agentic AI Is Changing Enterprise Operations, Function by Function

Pamela Sengupta
Read More
right blue arrow

The smartest use of AI in HR is knowing what not to automate

Prabal Laad
Read More
right blue arrow

From the month-end firefight to continuous finance: reimagining finance with AI

Prabal Laad
Read More
right blue arrow

Why Points Alone No Longer Earn Loyalty in 2026

Prabal Laad
Read More
right blue arrow

The Search Bar Is Dying on Your Own Site Too: Why On-Site AI Runs on Data, Not Chatbots

Prabal Laad
Read More
right blue arrow

Detecting UXO Without Ground Truth: Unsupervised AI in the Field

Nimitha U.
Read More
right blue arrow

From weekly cycles to always-on: reimagining commercial and merchandising with AI

Prabal Laad
Read More
right blue arrow

Proving AI ROI at a Business Level, Not Just a Task Level

Pamela Sengupta
Read More
right blue arrow

What to Actually Ask an AI Partner Before You Engage Them

Pamela Sengupta
Read More
right blue arrow

Build, Buy, or Partner? How to Decide Where to Deploy Your Internal AI Capability

Pamela Sengupta
Read More
right blue arrow

From firefighting to flow: reimagining operations and logistics with AI

Prabal Laad
Read More
right blue arrow

Data foundations before AI: Why Manufacturing Pilots stall and it's rarely the AI

Prabal Laad
Read More
right blue arrow

From sequential to parallel: what an AI-reimagined workflow actually looks like

Prabal Laad
Read More
right blue arrow

Architecting AI for Near-Zero Downtime: Implementing Circuit-Breaker Resilience in LLM API Gateways

Siddharth Sargar
Read More
right blue arrow

Agentic Commerce Is Here: What AI Shopping Agents Mean for Retail in 2026 and Beyond

Prabal Laad
Read More
right blue arrow

Building the Internal Business Case for AI-Readiness Investment

Prabal Laad
Read More
right blue arrow

Data foundations before AI: Why Manufacturing Pilots stall and it's rarely the AI

Prabal Laad
Read More
right blue arrow

Stop automating the past: why the biggest AI gains come from redesigning the work

Prabal Laad
Read More
right blue arrow
Choosing the Right AI Use Cases When You Have Hundreds to Pick From | VE3

Choosing the Right AI Use Cases When You Have Hundreds to Pick From

Pamela Sengupta
Read More
right blue arrow
 Making Your ERP AI-Ready Without Replacing It | VE3

Making Your ERP AI-Ready Without Replacing It

Pamela Sengupta
Read More
right blue arrow

Self-Funded Loyalty: Rewards That Pay for Themselves

Prabal Laad
Read More
right blue arrow

Data-Driven Sales in Automotive Distribution - Using Analytics to Identify Upsell Opportunities Across Your Customer Base

Pamela Sengupta
Read More
right blue arrow
The right agent, the right access, the right data

The right agent, the right access, the right data

Prabal Laad
Read More
right blue arrow

What Good Data Quality Looks Like: A Maturity Model and Roadmap for Enterprise Leaders

Prabal Laad
Read More
right blue arrow

How to Make AI-Readiness Progress When Your Tech Roadmap Is Already Full

Prabal Laad
Read More
right blue arrow

Why Your Products Aren't Showing Up in AI Search And Why It's a Data Problem, not a Marketing One

Prabal Laad
Read More
right blue arrow

No Trusted Data, No Useful Agents: The Foundation AI Actually Needs

Prabal Laad
Read More
right blue arrow

Adopt, Not Adapt: The Discipline That Makes ERP Succeed

Manish Garg
Read More
right blue arrow

EPR, FDP and Your Trust Data Layer: Drawing the Three Boundaries That Prevent Chaos

Prabal Laad
Read More
right blue arrow
Conversational AI for the Public Sector: Deflecting Demand Without Losing the Human Touch

Conversational AI for the Public Sector: Deflecting Demand Without Losing the Human Touch

Prabal Laad
Read More
right blue arrow

Procurement and Spend Control in Social Housing - What Oracle Fusion Procurement Brings to the Table

Pamela Sengupta
Read More
right blue arrow

Agentforce ROI in 2026: What the Numbers Actually Say and What a UK Business Could Realistically Expect

Prabal Laad
Read More
right blue arrow
Energy Ops

Why Opt For 24×7 Managed Services Model for Energy Ops

Suchita Dey
Read More
right blue arrow
Generative AI

Energy & Utilities: How AI/ML and GenAI are reshaping fair pricing and protection for the most at-risk customers

Ravi Gupta
Read More
right blue arrow

GenAI for Utility Contact Centres & Customer Experience: Driving Next-Generation Process Automation in Energy

Pamela Sengupta
Read More
right blue arrow

Migrating legacy MES/SCADA systems: a manufacturing and app modernization perspective

Pamela Sengupta
Read More
right blue arrow

Agentforce for Public Sector, FedRAMP- Redefining How Governments Serve People

Naman Rajvanshi
Read More
right blue arrow

Strengthening Cybersecurity Mechanism in a Digital World

Ritesh Nandurkar
Read More
right blue arrow

Understanding AI-Based Cybersecurity Attacks with the MITRE ATLAS Framework

Manish Garg
Read More
right blue arrow

Securing the AI Frontier: Comprehensive Response to DSIT's AI Cybersecurity Code of Practice

Pamela Sengupta
Read More
right blue arrow

The Emergence of Automated Cybersecurity Threats

Gaurav Roy
Read More
right blue arrow

AI in the Energy Sector : Our Response to Ofgem’s AI Consultation

Manish Garg
Read More
right blue arrow

Cybersecurity Testing: Shielding Digital Assets

Gaurav Roy
Read More
right blue arrow
Gray left-pointing arrow inside a white circular button.
Circular play button icon with a gray right-pointing triangle.

Turn Insights into Impact

Whether you are modernizing BI platforms, enabling self-service analytics, or embedding intelligence across the enterprise, VE3 helps you unlock the full value of your data.

Let's Connect
Woman sitting on couch wearing a white cable-knit sweater and blue jeans, holding a phone with one hand.
  • © 2026 VE3. All rights reserved.
LinkedIn logo in white on a gray circular background.Facebook social media icon with white f on a gray circular background.Gray circle with white X symbol, indicating a close or cancel button.Gray play button icon within a rounded square with a subtle drop shadow on a white background.